Pathoscope
The Pathoscope workflow is used for detecting known reference OTUs in an Illumina sample library.
How does it work?
Sample reads are mapped against a Virtool reference and reads matching OTUs are counted and used to arrive at a detection result. To understand this section, you must be familiar with references and OTUs.
The first step of the workflow involves mapping sample reads against default isolates of all OTUs in the target reference. This can be thought of as a fishing or prescreening step for OTUs that may be potentially represented in the sample. Any OTUs with at least one matching read are retained as candidate hits for the second step.
The second step begins with the creation of a Bowtie2 mapping index containing all isolates of the OTUs identified in the default isolate mapping. This step provides a more diverse mapping target for each virus and allows isolate-level detection.
A major complication of this diagnostic method is multi-mapping, where a single read aligns to multiple positions in the reference sequences. Although a sample may contain only a small number of true source sequences, reads from one source can align to multiple locations in the Virtool reference. This is especially common when an OTU contains many similar isolates.
Virtool uses the Pathoscope2 library to reassign multi-mapped reads to their most likely source sequences. An expectation maximization (EM) algorithm is used to perform the reassignment. Pathoscope makes the assumption that source sequences with high numbers of uniquely mapped (not multi-mapped) reads are most likely to be real source sequences. Read counts are fractionally reassigned when a read maps to multiple genomes.
Quality
Analysis quality is determined by running Pathoscope and/or Nuvs on your sample of interest. These analyses can be found under the Analyses tab.
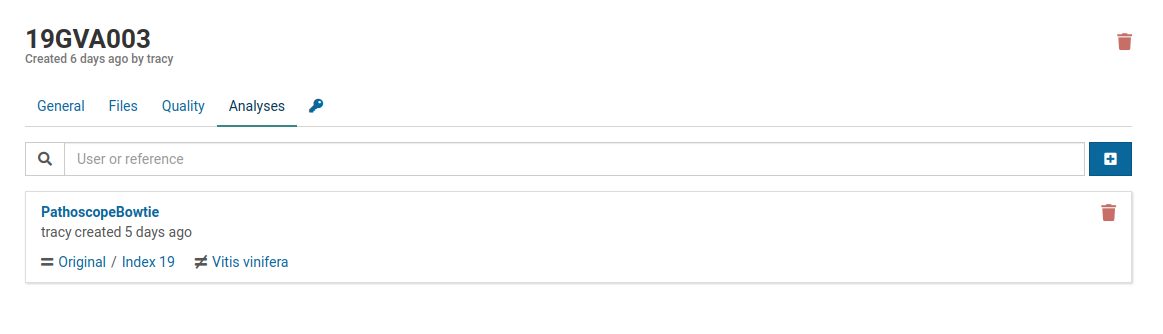
Click the PathoscopeBowtie.
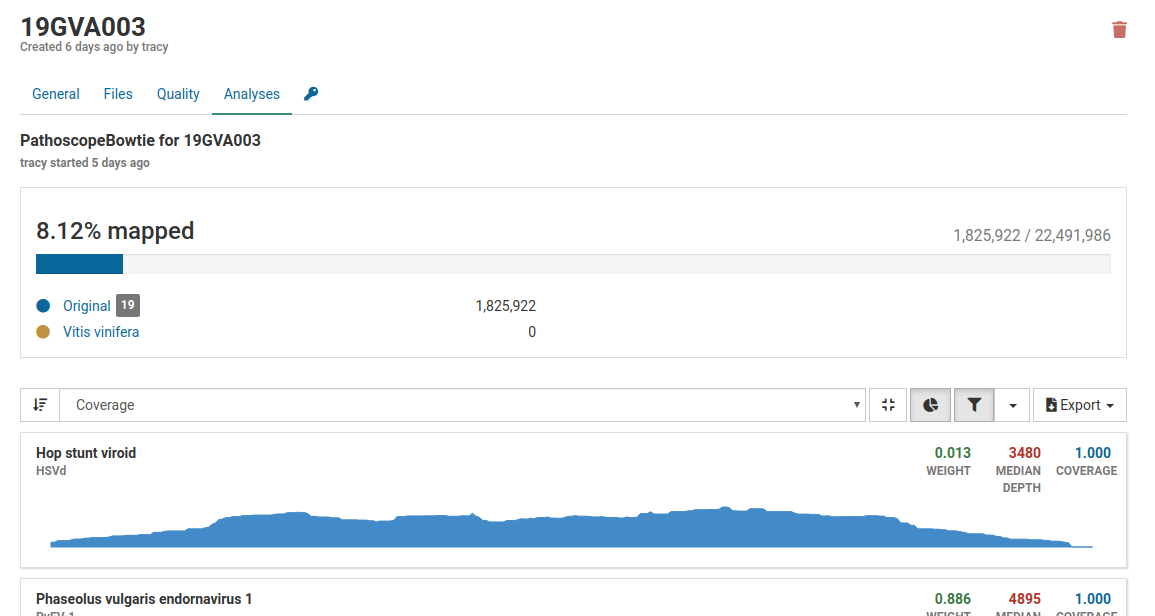
Pathoscope uses mapped-read percentage, coverage, depth, and weight to determine whether a known virus is present in a sample.
Generally, approximately 5 million reads is a good base line for a dsRNA library, but the percentage of mapped reads is of greater importance. For dsRNA, percentages can range from less than 1% to greater than 80%. Greater viral RNA enrichment, measured by the percentage of mapped reads, reduces the total number of reads required. For example, 2% of 5 million reads or 100 000 mapped reads is good.
Other statistics include:
Coverage: a measure for how well the mapped reads cover the viral genome. In general, coverage of greater than 0.5 indicates positive detection and coverage less than 0.2 indicates negative detection.
Depth: a measure of how many times a genome is covered by mapped reads.
Weight: the calculated proportion of reads mapping to a virus. The weight is roughly proportional to the titre. Higher the titre, higher the weight. A weight greater than 0.001 is a strong indicator of positive detection.
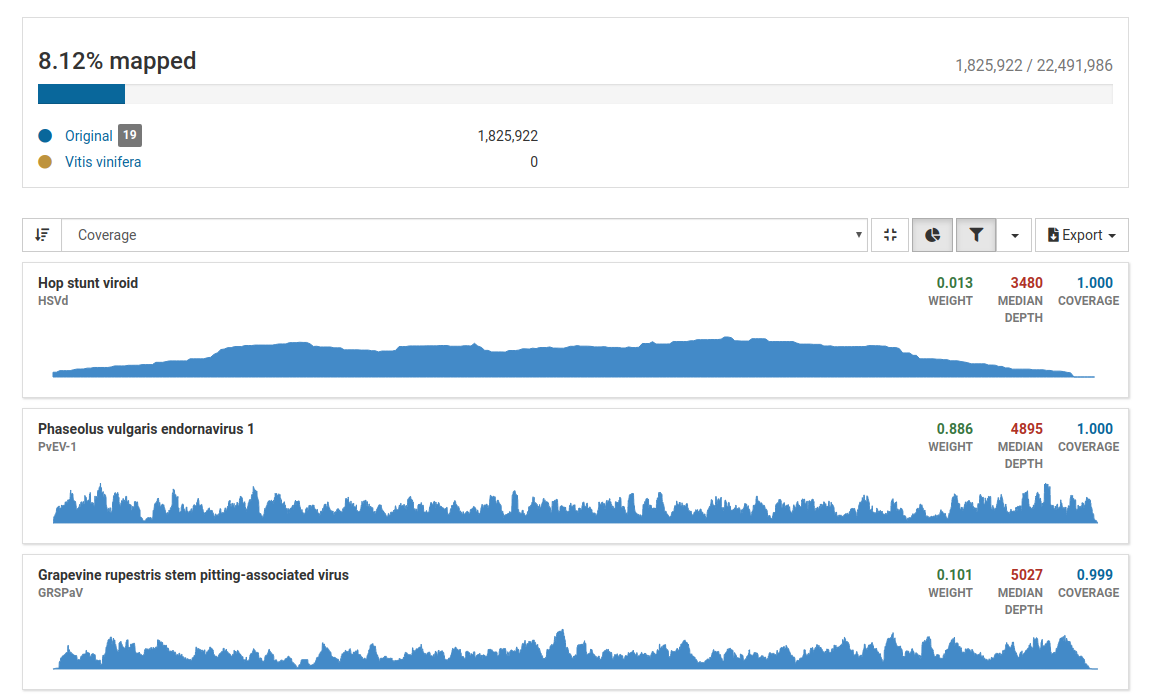
Three pathogens are likely to be in the sample. Although the total number of mapped reads is less than 5 million, the percentage of mapped reads is 8.12%, which is a good indicator of enrichment of viral RNA.
Additionally, all three pathogens have high weight, depth, and coverage values, so the pathogens can be confidently identified as present in the sample.
Further analysis with Nuvs isn’t necessary for this sample. High weight and depth combined with low coverage would instead suggest that the virus sequence differs from the database reference. This may represent a new genotype or a new, closely related virus.